


What is the RSI indicator in crypto trading?
Crypto prices can change quickly. A coin may rise sharply in a few hours and then lose part of those gains just as fast. For traders, understanding the strength behind these price movements can be useful when deciding whether to enter, exit, or simply wait.
One of the most commonly used technical indicators for measuring market momentum is the Relative Strength Index, or RSI.
RSI helps traders understand whether buying or selling has been particularly strong over a recent period. It is simple to read, which makes it popular among beginners as well as experienced traders.
What is RSI?
RSI stands for Relative Strength Index. It is a momentum indicator that measures the speed and strength of recent price movements.
The indicator moves on a scale between 0 and 100 and usually appears as a line below the main price chart.
The standard RSI setting uses 14 periods. The meaning of a period depends on the chart being viewed. On a daily Bitcoin chart, for example, RSI would calculate momentum using the previous 14 daily candles. On a one-hour chart, it would use the previous 14 hourly candles.
RSI compares recent price gains with recent price losses and converts that information into a number between 0 and 100.
How do you read RSI?
There are two important RSI levels that traders commonly watch.
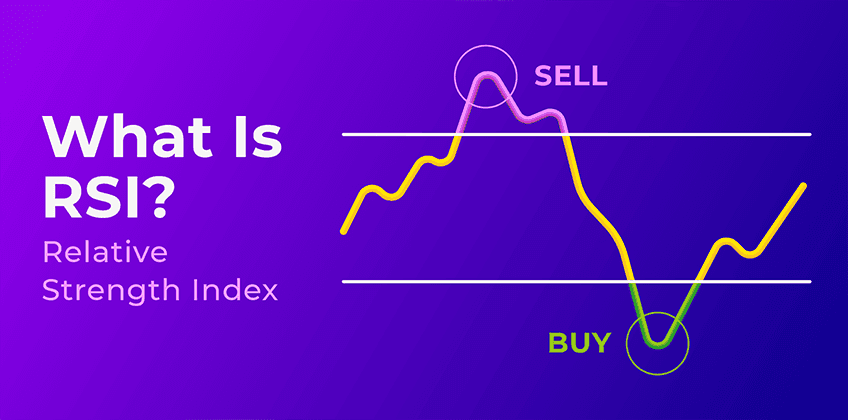
Above 70: Overbought
An RSI reading above 70 suggests that the asset has experienced strong buying momentum and may be considered overbought.
Below 30: Oversold
An RSI reading below 30 suggests that the asset has experienced strong selling momentum and may be considered oversold.
An RSI between 30 and 70 is generally considered a more neutral range.
These levels are useful, but they should not be treated as automatic trading signals.
What does overbought mean?
Suppose Bitcoin rises quickly over several trading sessions and its RSI reaches 75. This tells traders that recent buying momentum has been strong. Some traders may begin watching for signs that the rally is losing strength. However, overbought does not necessarily mean the price is about to fall.
During a strong bull market, RSI can remain above 70 while the price continues moving higher. Selling an asset simply because its RSI crosses 70 can therefore result in exiting a strong trend too early.
Traders usually look for additional information from price action, resistance levels and trading volume.
What does oversold mean?
An RSI below 30 indicates strong recent selling pressure. Imagine Ethereum falls rapidly and its RSI reaches 25. Traders may start watching for signs that selling momentum is weakening and whether the price is approaching an important support level. But oversold does not automatically mean the price will recover.
During a strong downtrend, RSI can remain below 30 while prices continue falling. Traders should therefore avoid treating an oversold reading as a guaranteed buying opportunity.
What is RSI divergence?
RSI can also help traders identify situations where momentum and price are moving differently. This is known as divergence.
A bullish divergence occurs when the price makes a lower low while RSI forms a higher low. This may indicate that selling momentum is becoming weaker, even though the price has moved lower.
A bearish divergence happens when the price makes a higher high while RSI forms a lower high. This may suggest that buying momentum is weakening.
Divergence can provide useful information, but it does not guarantee a reversal. Markets can continue moving in the same direction even after divergence appears.
How does RSI behave during trends?
RSI should also be viewed in the context of the broader market trend.
During a strong uptrend, RSI may regularly move above 70 and remain elevated for longer periods. It may also find support around 40 or 50 instead of falling below 30.
During a strong downtrend, RSI may remain in the lower part of its range for longer periods.
This is why experienced traders do not look only at whether RSI has crossed 30 or 70. They also consider the direction of the overall market.
Can RSI be used for Futures trading?
RSI can be used for both Spot and Futures trading.
A Futures trader, for example, may notice that RSI is approaching oversold territory while the price is also near an established support level. This could encourage the trader to watch for further confirmation before considering a Long position.
Similarly, an overbought RSI near resistance may encourage a trader to watch for signs of weakening momentum before considering a Short position.
However, Futures trading involves additional risk, particularly when leverage is used. RSI should never be the only reason for opening a position.
Common mistakes when using RSI
One of the biggest mistakes beginners make is assuming that RSI above 70 means sell and RSI below 30 means buy.
Markets are rarely that simple.
Another mistake is using RSI without considering support and resistance. A reading becomes more meaningful when it is viewed alongside the actual price chart.
Traders should also avoid relying on a single indicator. RSI may work better when combined with price action, volume, moving averages or other technical tools.
Most importantly, no RSI signal can predict the market with certainty.
Is RSI useful for beginners?
RSI can be a useful starting point for beginners because it is relatively easy to understand.
Instead of trying to predict exactly where Bitcoin or another crypto will move next, RSI allows traders to ask a simpler question: How strong is the current momentum?
That information can then be combined with other factors before making a trading decision.
Conclusion
The Relative Strength Index is a popular technical indicator used to measure momentum in crypto markets.
RSI moves between 0 and 100. Readings above 70 are generally considered overbought, while readings below 30 are considered oversold. Traders can also use RSI to identify divergence and changes in market momentum.
However, RSI is not a standalone trading strategy. An asset can remain overbought or oversold for longer than expected, particularly during strong trends.
The best approach is to use RSI alongside price action, support and resistance, market trends and proper risk management. For beginners, understanding this limitation is just as important as learning how to read the indicator itself.
Disclaimer: Crypto products and NFTs are unregulated and can be highly risky. There may be no regulatory recourse for any loss from such transactions. Please do your own research before investing and seek independent legal/financial advice if you are unsure about the investments.
Updated on: 24th August, 2026 3:11 PM


FAQ's
1. What is RSI in crypto trading?
RSI, or Relative Strength Index, is a technical indicator that measures the momentum of recent crypto price movements. It ranges from 0 to 100 and helps traders identify periods of strong buying or selling activity.
2. What does an RSI above 70 mean in crypto?
An RSI above 70 is generally considered overbought, meaning the crypto has experienced strong buying momentum. However, it does not necessarily mean the price will fall, as RSI can remain above 70 during a strong uptrend.
3. What does an RSI below 30 mean?
An RSI below 30 is generally considered oversold, indicating strong recent selling momentum. Traders may watch for a possible change in momentum, but an oversold RSI does not guarantee that the price will recover.
4. What is the best RSI setting for crypto trading?
The standard RSI setting is 14 periods, and it is widely used across crypto markets. The period adjusts to the timeframe being analysed, such as 14 hourly candles on a one-hour chart or 14 daily candles on a daily chart.
5. What is RSI divergence in crypto?
RSI divergence occurs when the direction of an asset's price differs from the direction of its RSI. Bullish divergence may indicate weakening selling momentum, while bearish divergence may indicate weakening buying momentum.
6. Can RSI be used for Bitcoin and crypto Futures trading?
Yes. RSI can be used for Bitcoin, altcoins, Spot markets and Futures trading. Traders often combine RSI with support and resistance, price action, volume and other indicators before making trading decisions.
7. Is RSI a reliable indicator for crypto trading?
RSI can provide useful information about market momentum, but it cannot reliably predict price movements on its own. Crypto traders should use RSI alongside other technical indicators, market trends and appropriate risk management.
8. Is RSI suitable for beginners in crypto trading?
Yes. RSI is one of the easier technical indicators for beginners to understand because it uses a simple 0-to-100 scale. However, beginners should avoid treating RSI readings above 70 as automatic sell signals or readings below 30 as automatic buy signals.


